Map visualization optimization techniques 🗺️
Dataviz
![]()
Raúl Jiménez Ortega | @hhkaos
- From Nerja (Málaga)☀️⛴️ ; living in Almería 🌵😎
- Family guy 👨👩👦👦
- Geek 👨🏻💻
- Product Engineer @ Esri 🥑🇺🇸
- 10 years running GeoDevelopers.org 🗺️🌍

1. Initial loading times
2. Fluency of interaction
3. Costs
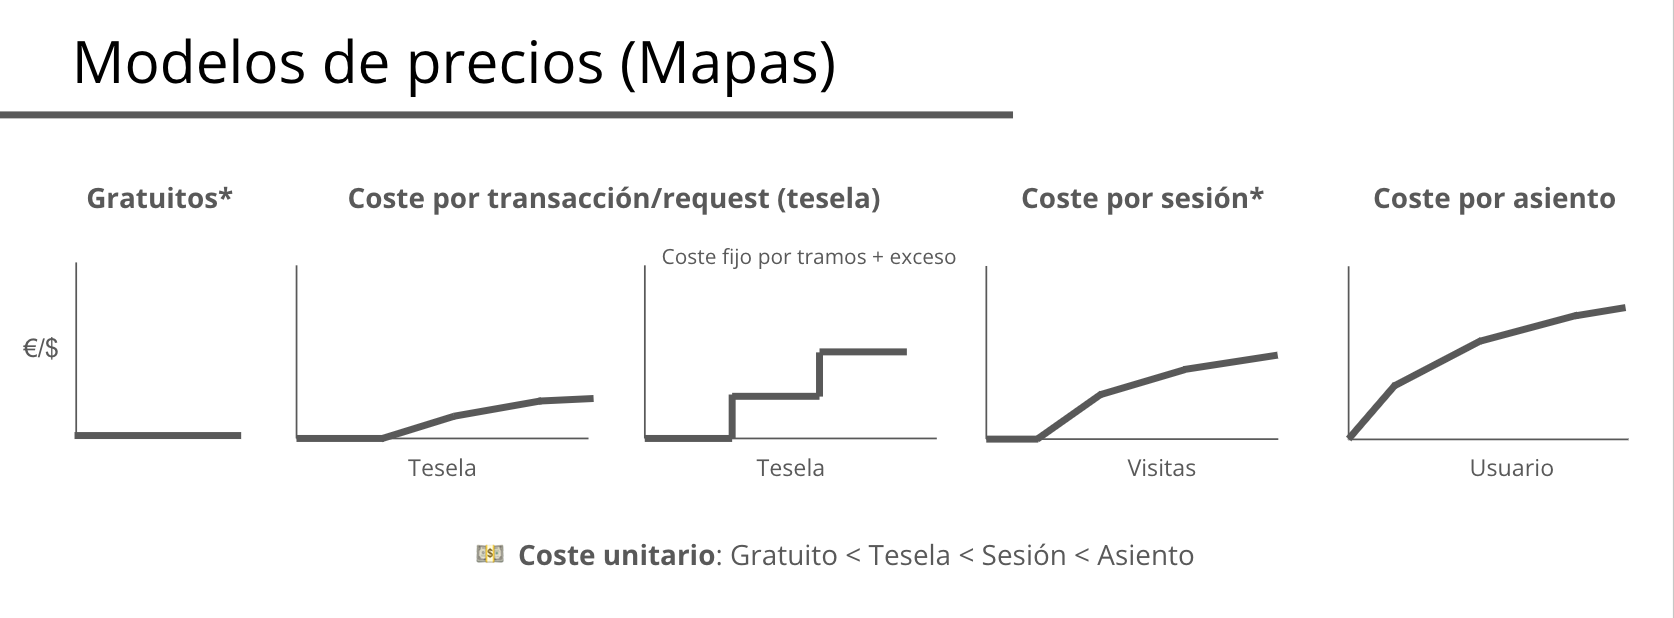
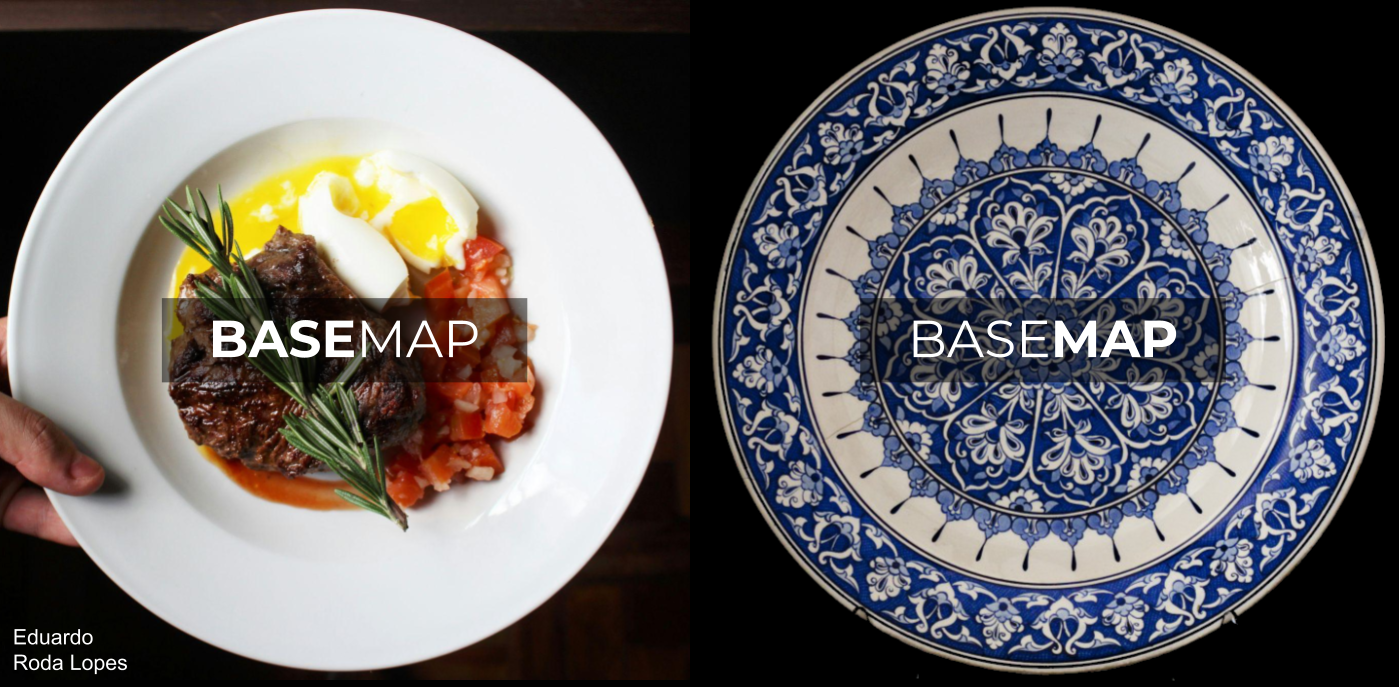
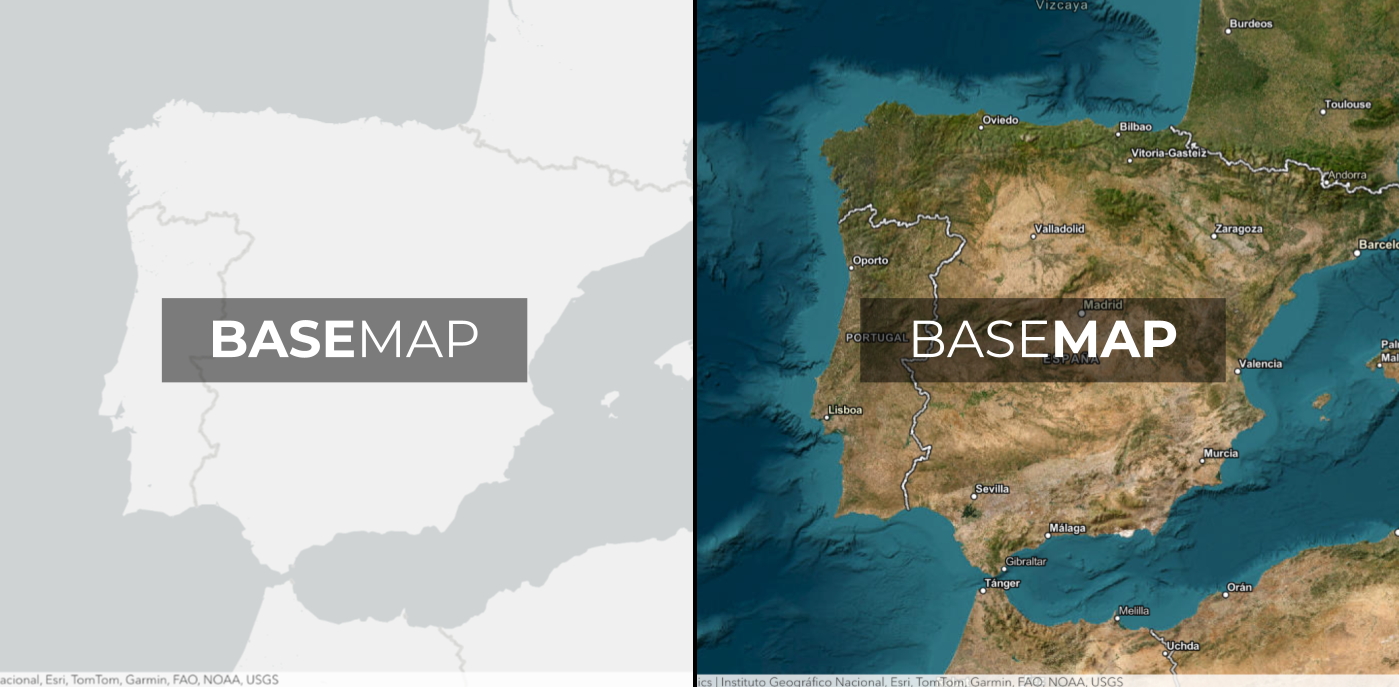
Basemap Pricing Models
Watch: Intro to base maps (ES)
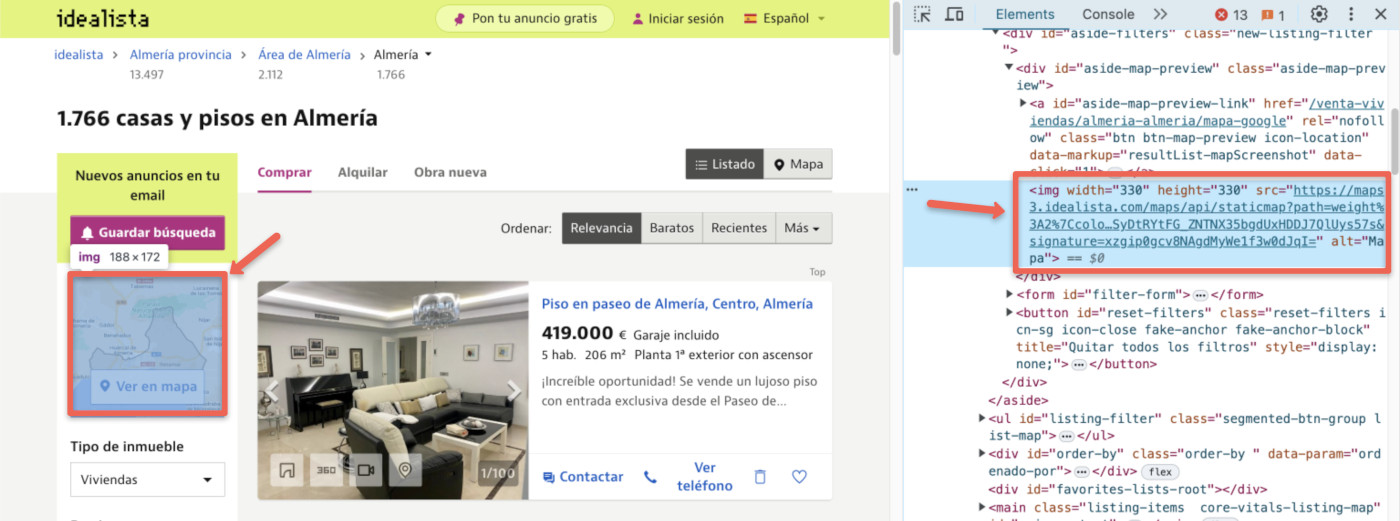
Static maps
Dynamic maps
Interactive maps
Reduce bytes sent over the network
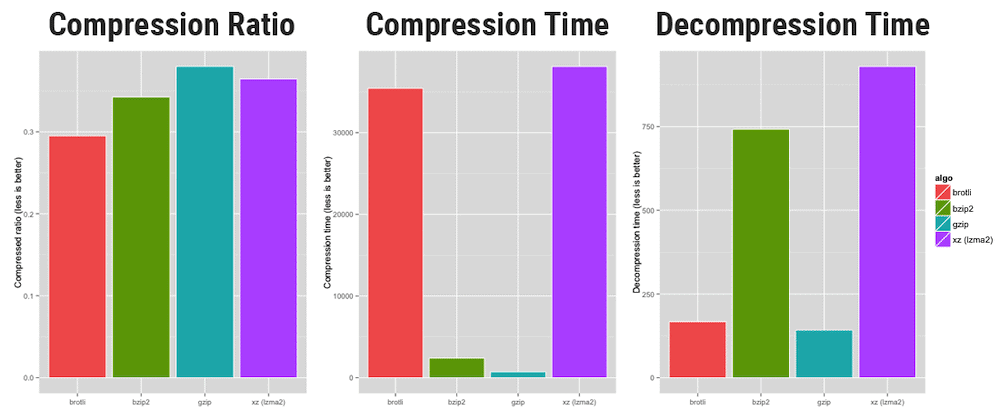
Ratio, compression and decompression time by algorithm | Source: OpenCPU
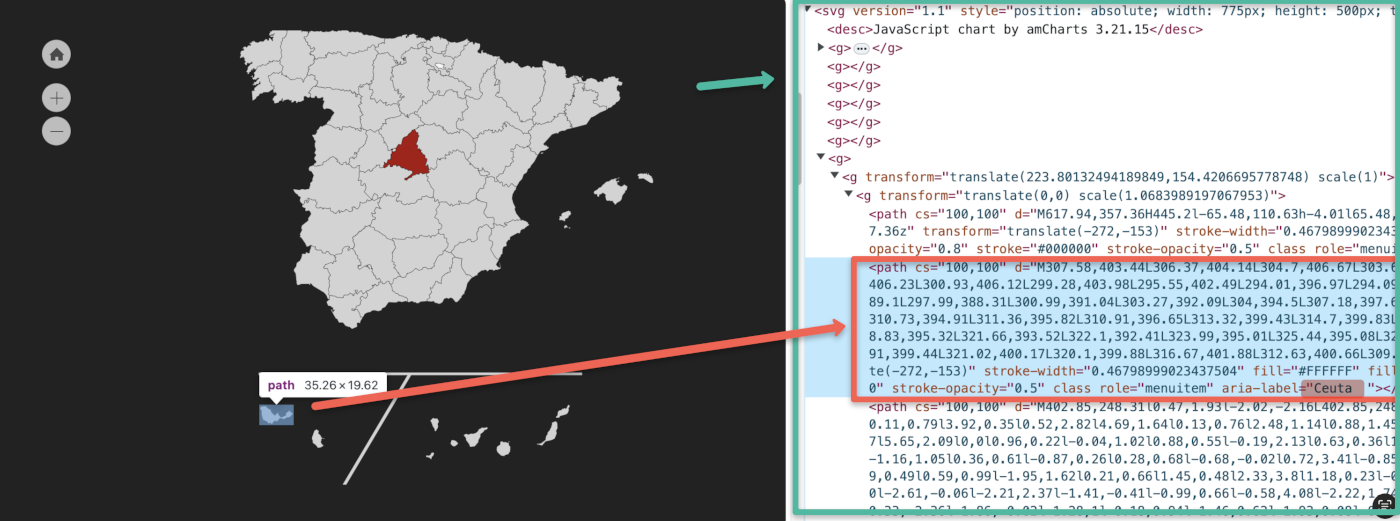
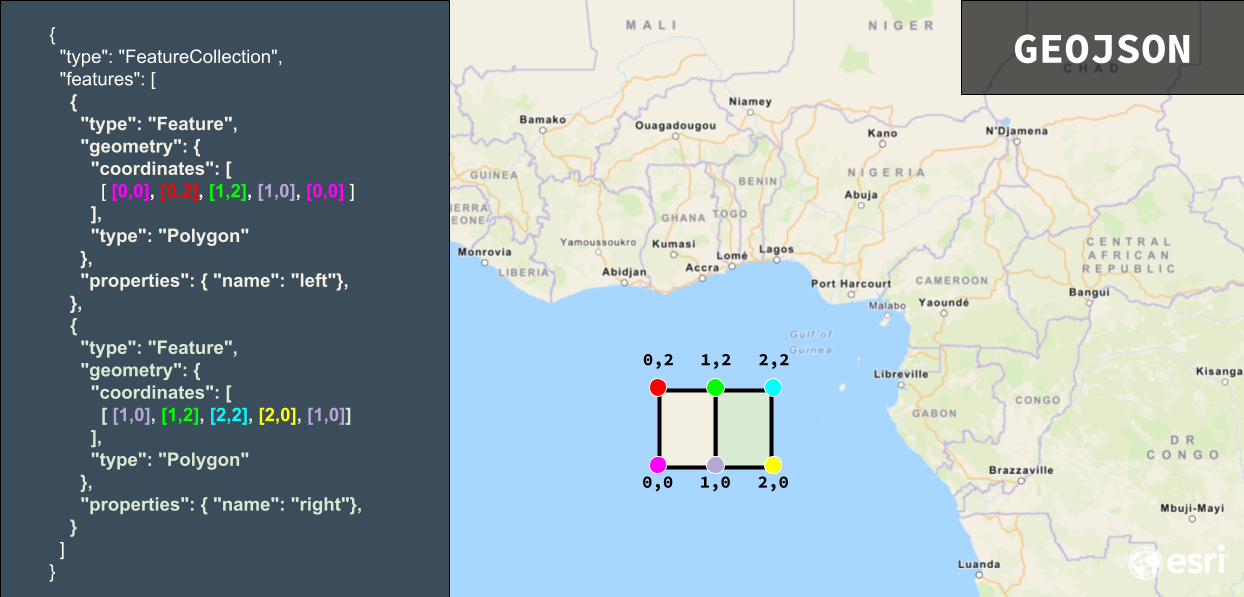
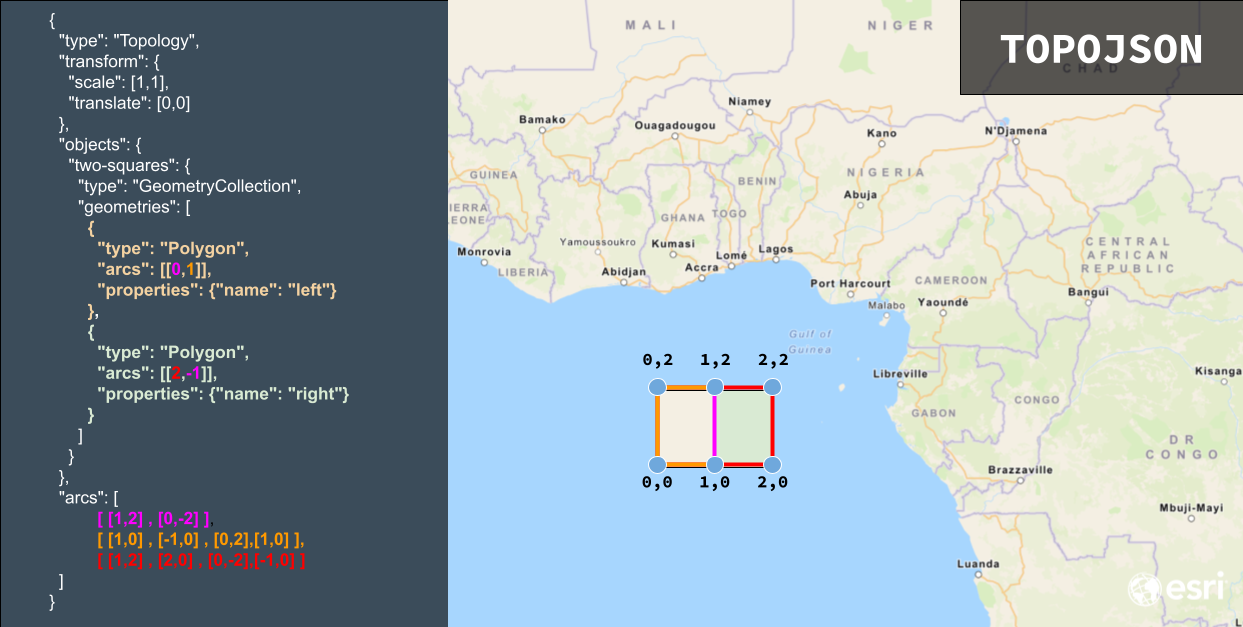
GeoJSON standard (RFC 7946)
Reduce the size of the dataset
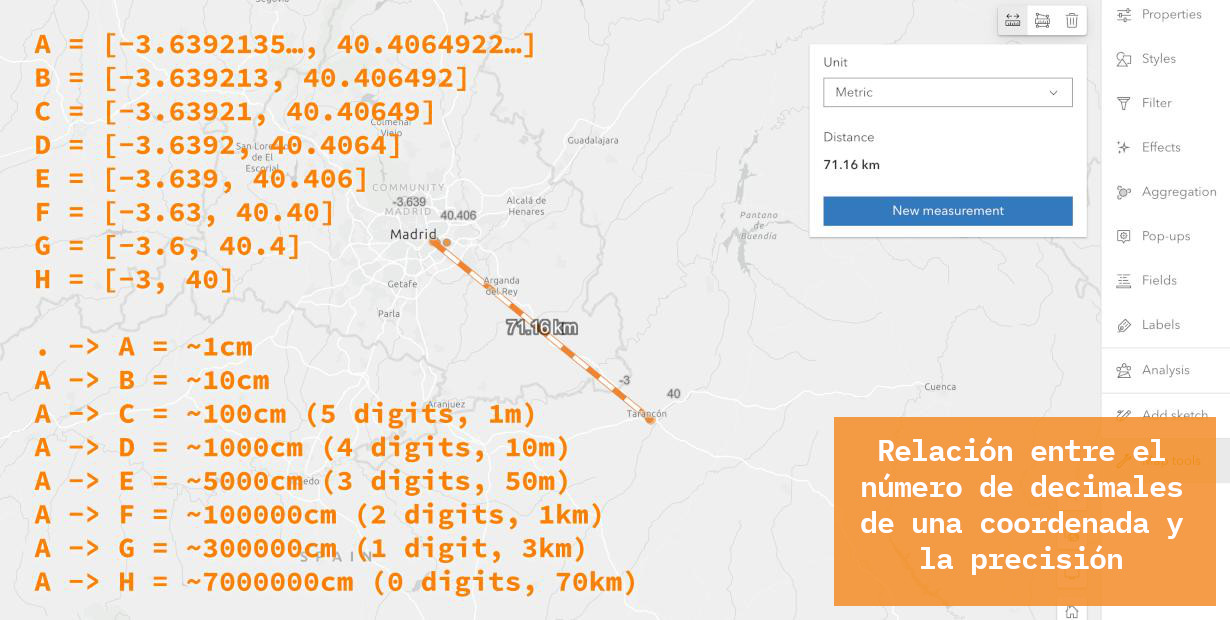
Relationship between the number of decimals of a coordinate and precision
Poligons or lines
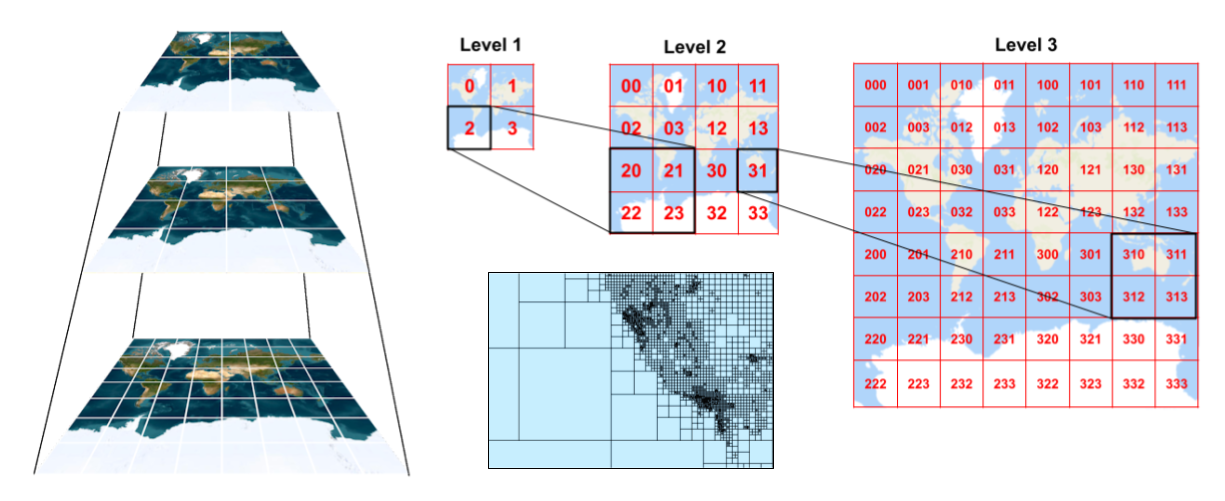
Chop the data
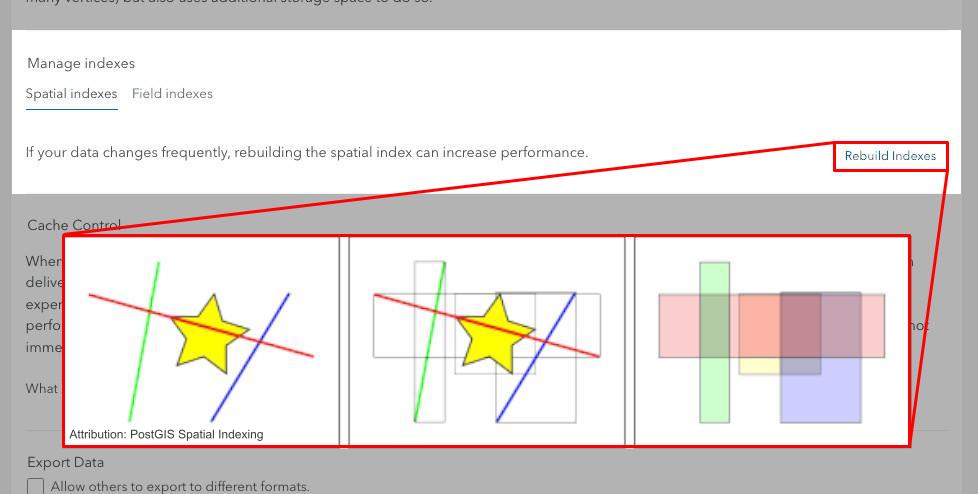
Cache as much as possible!

Create spatial indexes
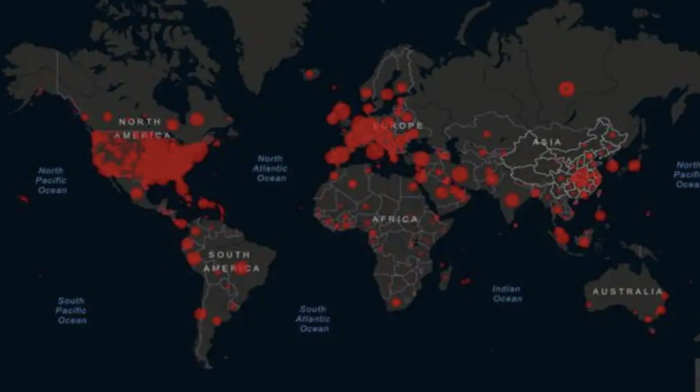
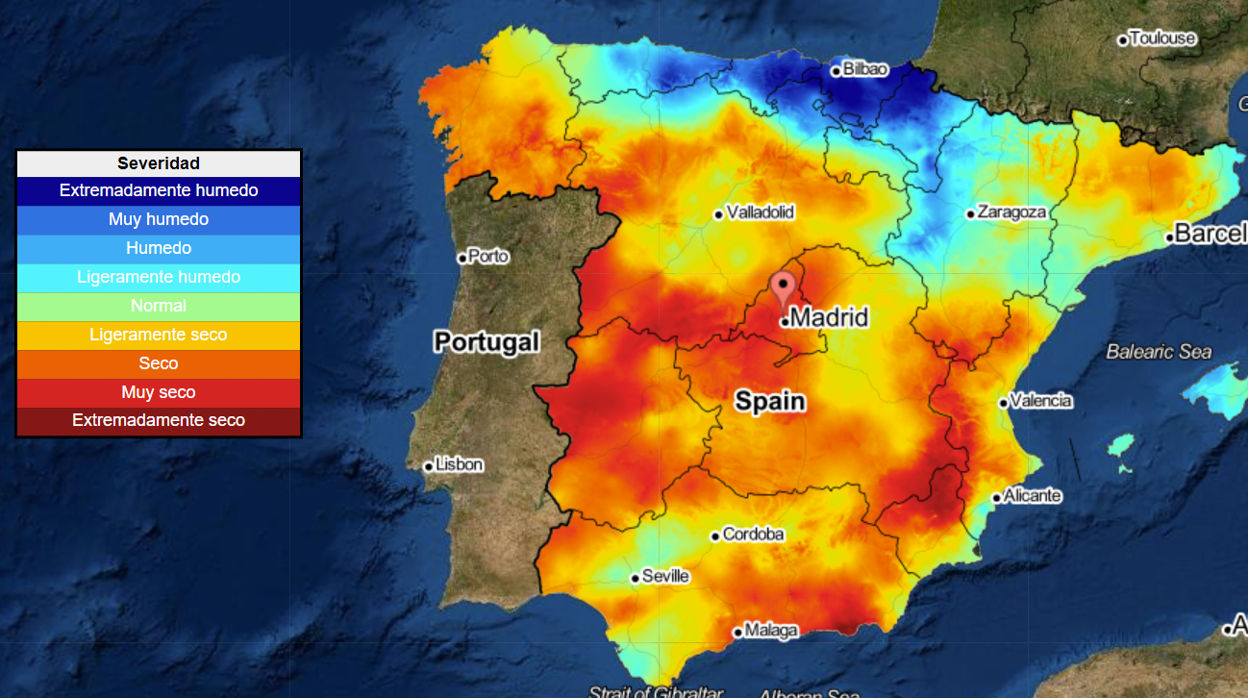
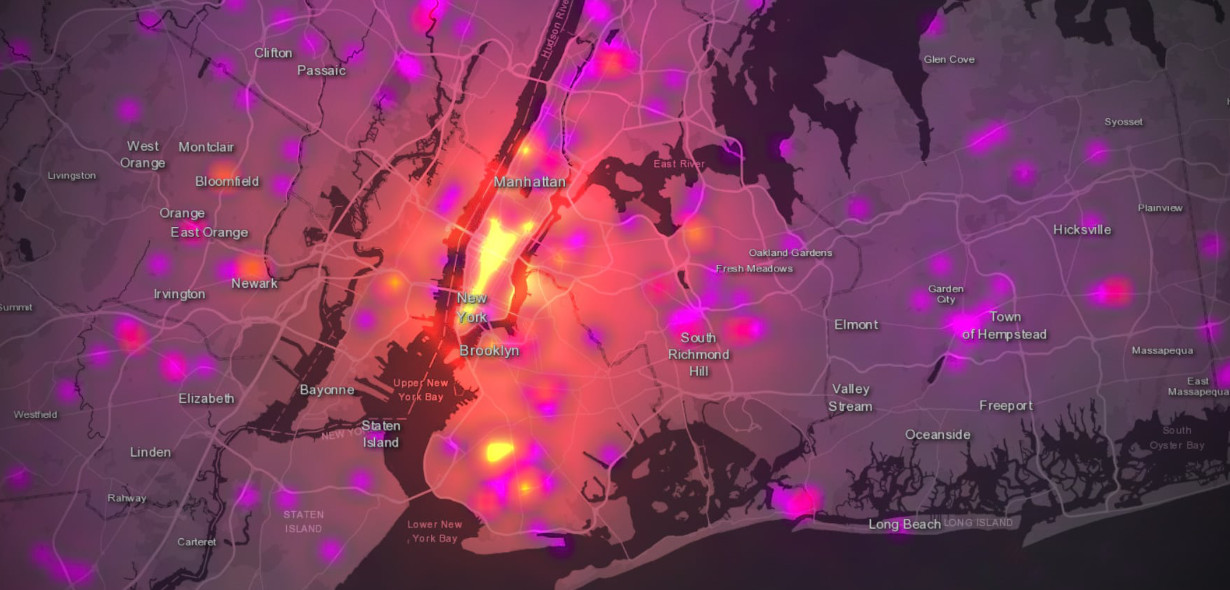
Heatmaps 🔥
Dataviz
Dataviz
If I could travel in time…
I would
- Sliced using feature layers (not images)
- Used clusters (not points)
- I would have used cache (near real-time)
- Statistics on the client (not server)
- Used protomaps